One of our biggest projects this year was our collaboration with Ference and Co. on Employment and Social Development Canada’s Tackling Poverty Together report. This report was the largest in-depth report on Canadian poverty in at least a generation. Ference & Co. spent almost nine months gathering information and input from across the country. The report focuses on six cities/towns across the country: Saint John, NB; Trois-Rivières, QC; Regent Park (Toronto), ON; Winnipeg, MB; Tisdale, SK and Yellowknife, NWT. Tackling Poverty Together shares insights on a number of topics around the many aspects of poverty in Canada and specific groups that live in poverty, including mental health, addiction, single parenthood, and First Nations communities.
Tackling Poverty Together Report
What We Delivered:
- Document Design
- Photo Editing
- French Translation Services
- Print Design
- Copyediting and Proofing
The Challenge
Our work on the Tackling Poverty Together report involved two primary challenges. First off was ensuring that the document had a narrative quality running through it. Since one of the report’s main goals was to tell the emotional stories of people struggling with poverty, we wanted our design to aid this goal. Using this tactic was also another way to make the report more readable, like a magazine rather than a federal report.
Another challenge was working with what photography we had. One factor of this project was that we couldn’t use professional or stock photography. All of the photography that we used was captured by either interviewers or interviewees, in the specific communities that were profiled in the report. This presented a unique challenge, which our designers had to be especially creative to handle.
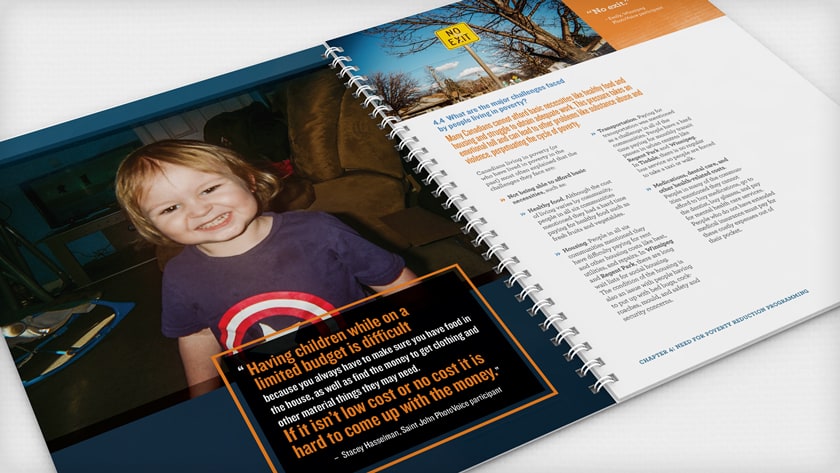
An example of the emotional, authentic photography used throughout the report.
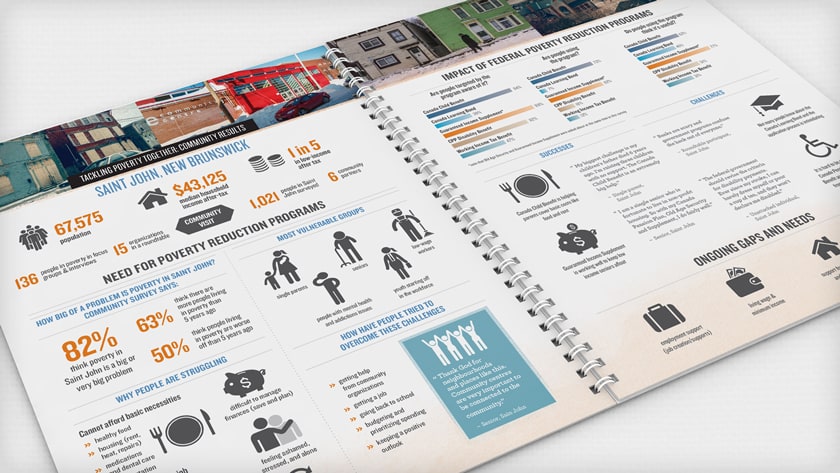
Infographics detail for Saint John, New Brunswick.
The Strategy
Meeting the challenges explained above was our key goal on this project. What we wanted to create was something similar to what Vice Magazine creates: a gritty, authentic magazine-style report. Interviewees were given disposable cameras and very simple instructions: capture your everyday life. The photography that we received showcased the exact problems outlined in the report. For instance, one elderly woman with mobility issues shared plenty of photos of the decrepit state of the sidewalks in her city. She has to drive her electric scooter on them everyday, and it severely hinders her ability to get around. Using these direct examples of the poverty crippling Canadian communities, we were able to better engage readers.
Calling out statistics was a common strategy for conveying information quickly and accessibly.
Results
We produced a few different versions of the report. First was a 72 page summary report, which we created in both English and French in time for the Reduce Poverty conference in Ottawa. Our work on this report received a special shoutout from the Federal Minister of Families, Children, and Social Development, Jean-Yves Duclos. We also produced a larger, 192-page version of the document, which included complete appendices of all of the data and information that was collected for each of the six cities, including infographics and online links.