We worked closely with the Ministry of Transportation & Infrastructure of British Columbia and BC Stats on developing the province’s Active Transportation Strategy General Population Survey Report (2019), Report Card, Infographics, & Web Icons. In which we provided extensive services in creative conceptualization, graphic design, data visualization, and copywriting/editing.
What We Delivered:
- Document Layout & Design
- Report Card Layout & Design
- Graphic Design
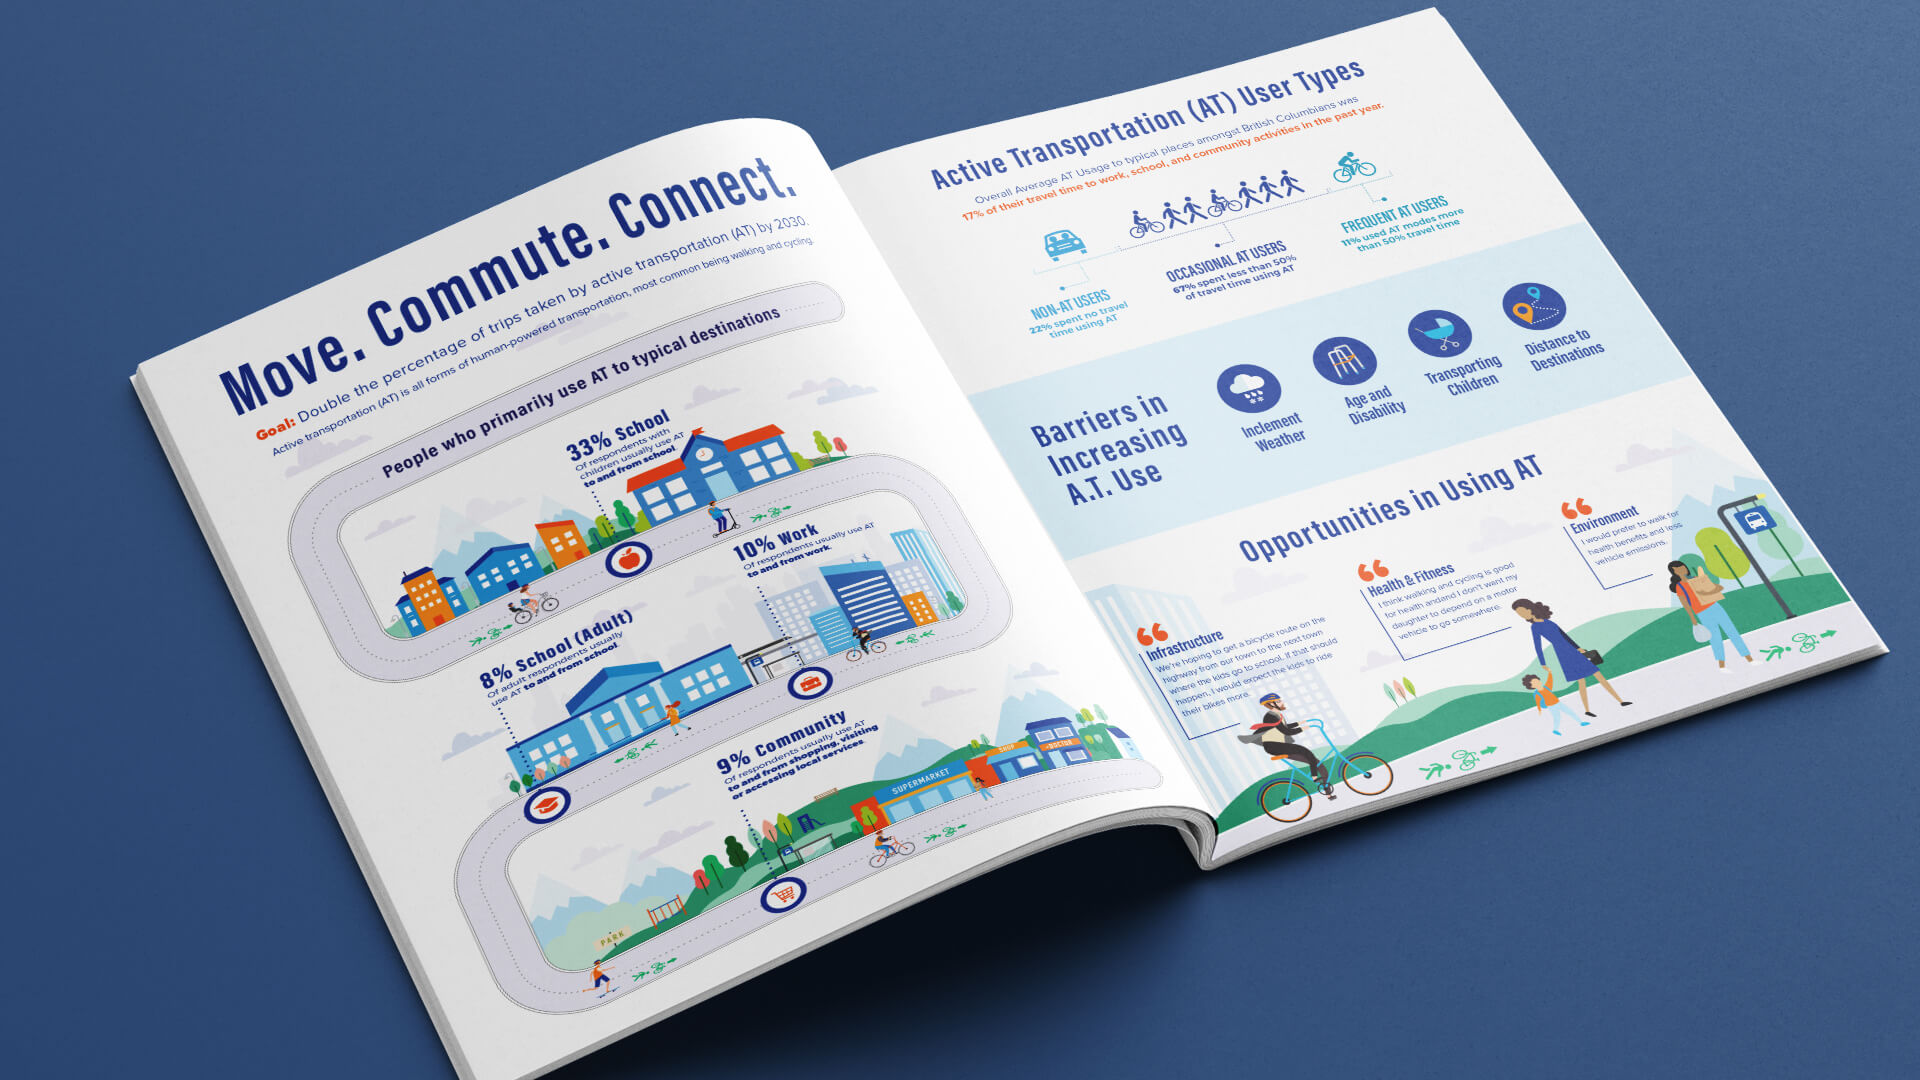
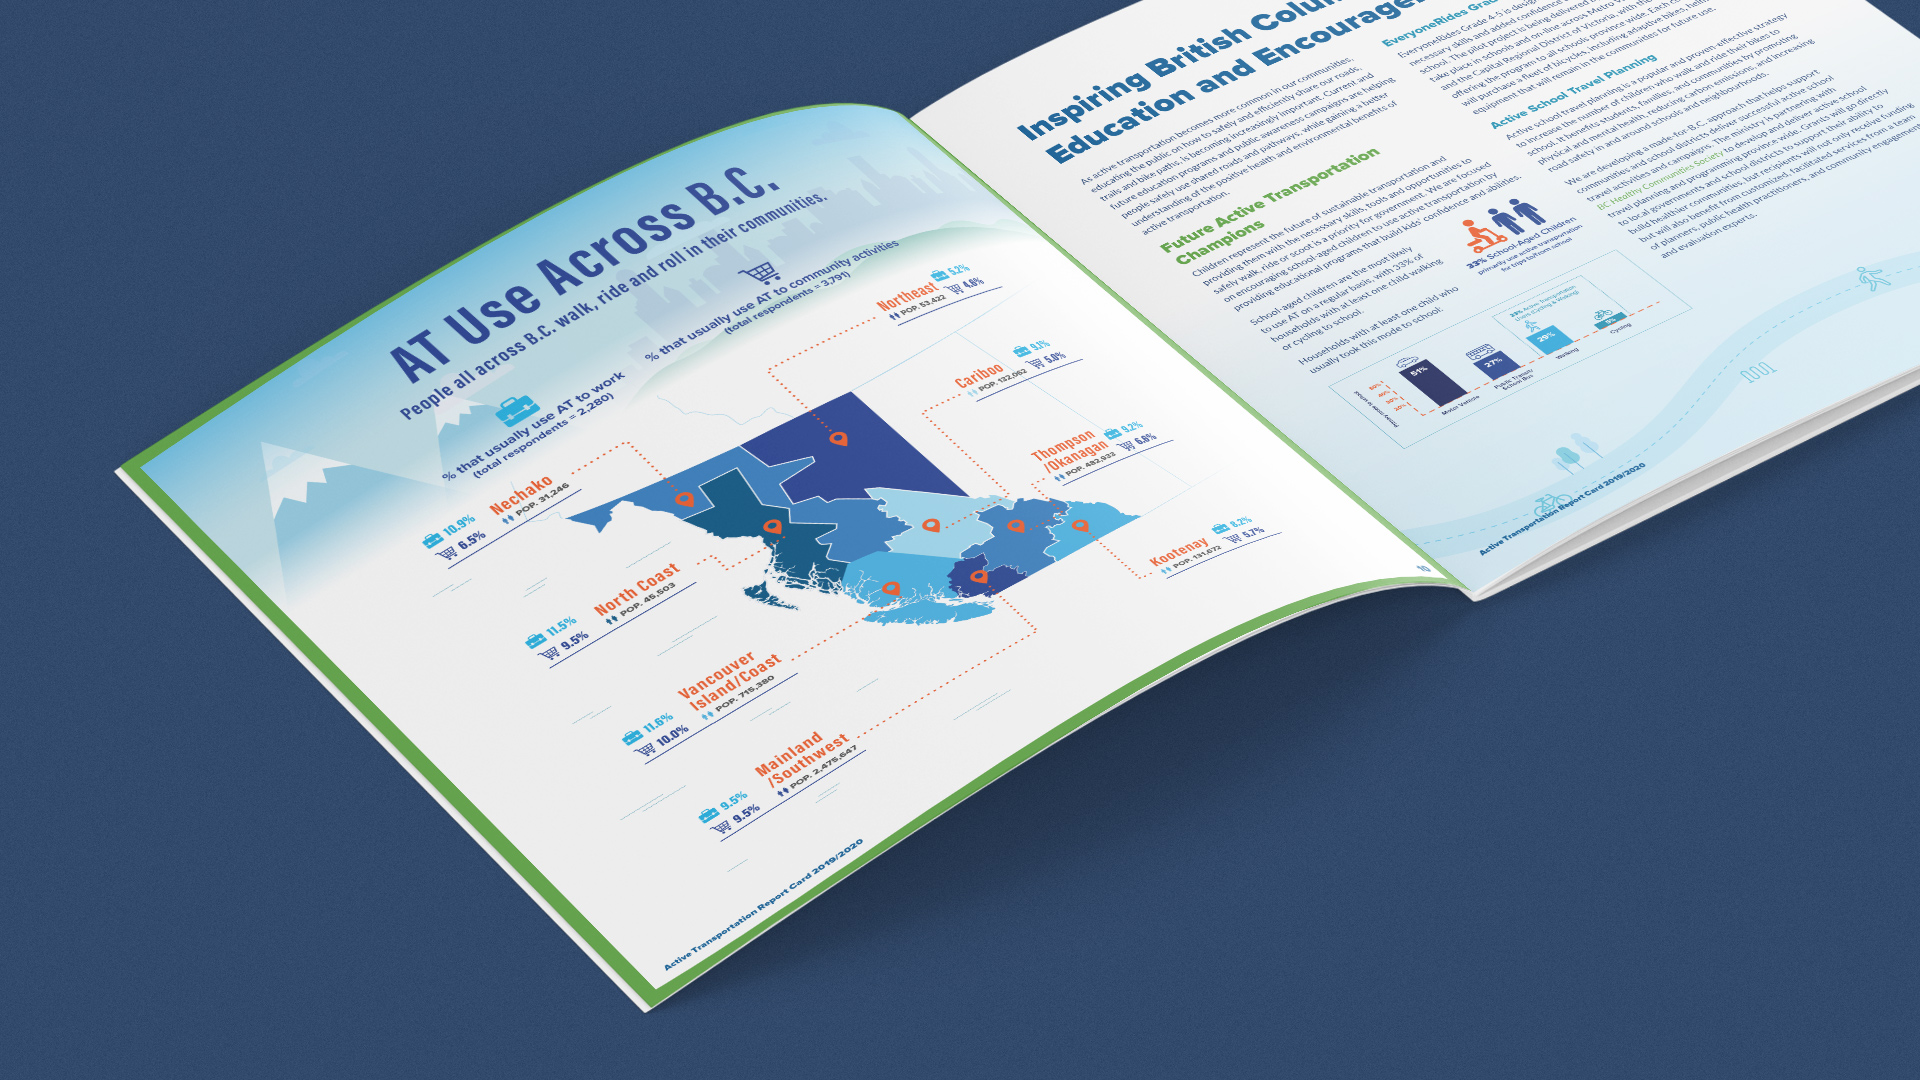
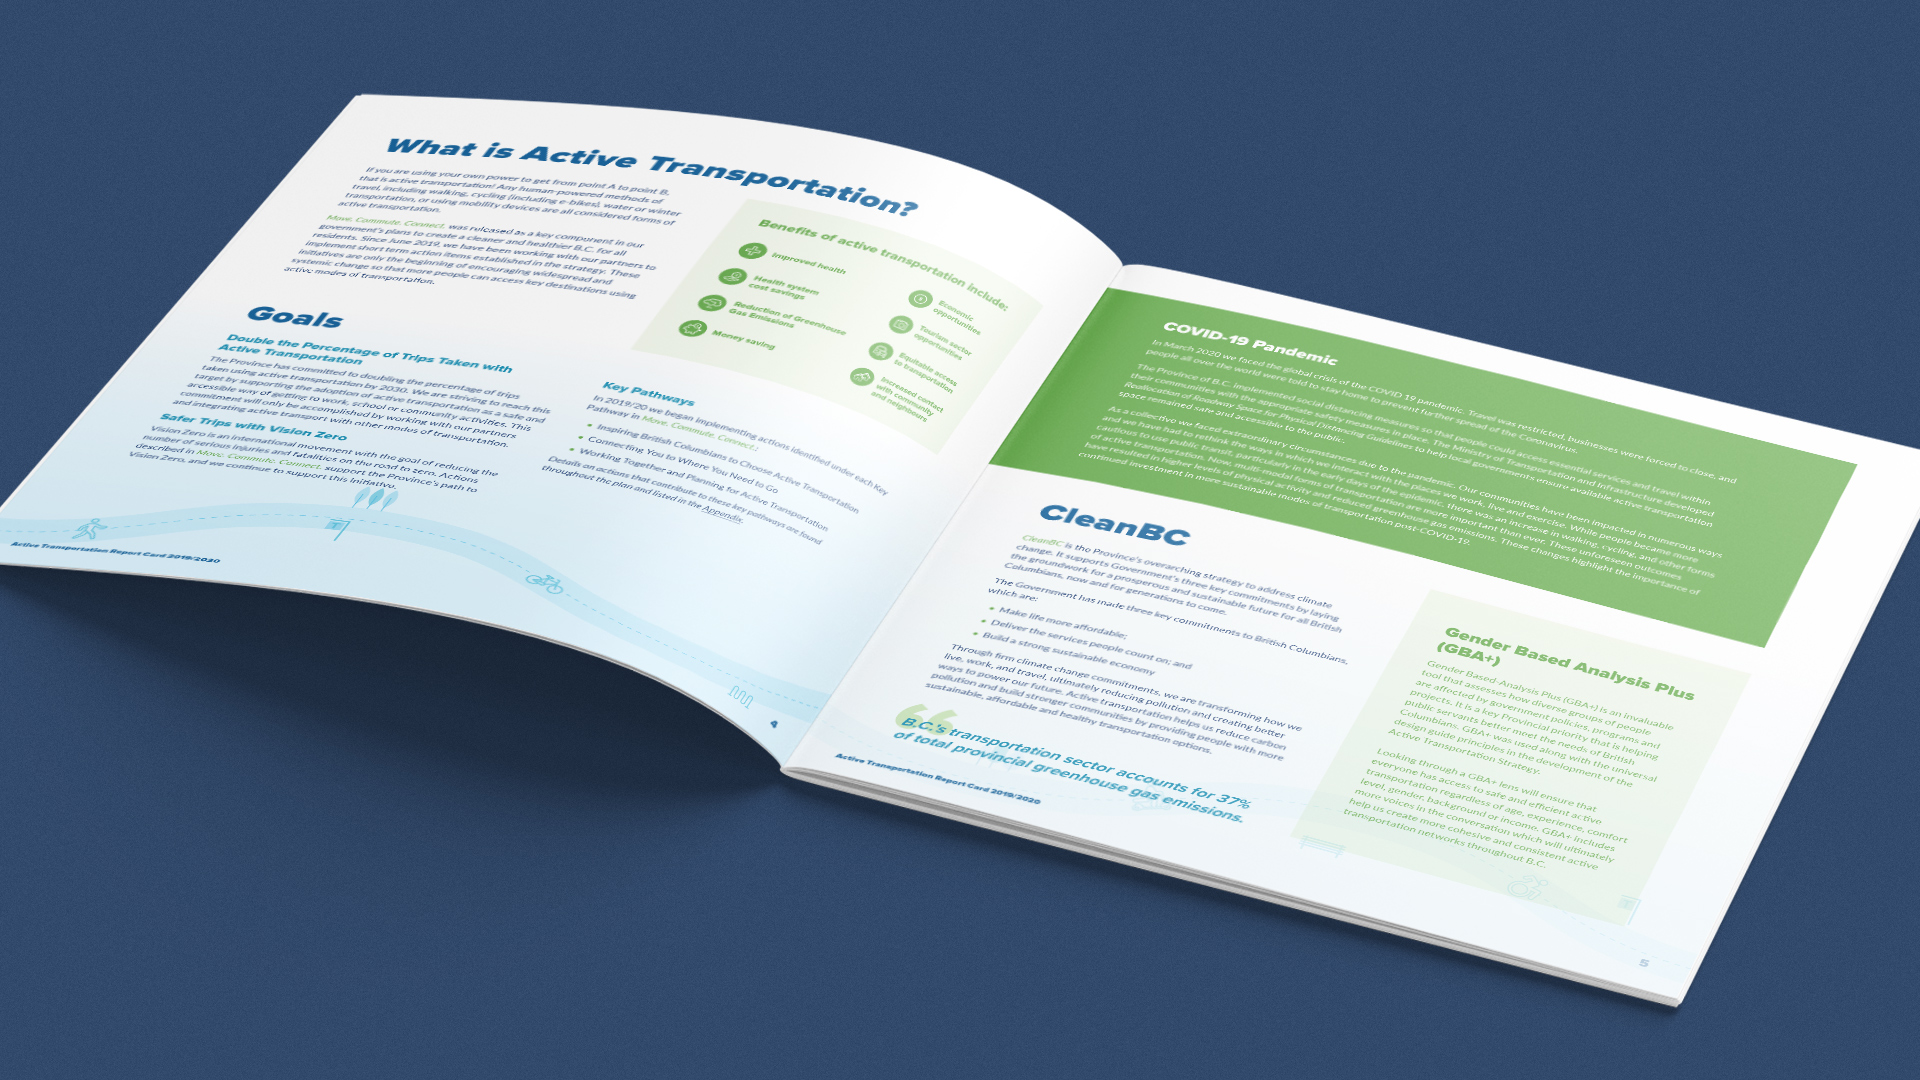
- Data Visualization & Infographics
- Custom Illustrations & Web Icons
- Content Consultation & Copyediting
The Challenge:
As a public facing document that is heavy with statistics and numbers on Active Transportation usage in the Province. Our goal was to ensure that the content remains easily digestible for the average British Columbian while maintaining accuracy in the information presented. All content developed adheres to the Ministry of Transportation and Infrastructure, Government Communications and Public Engagement (GCPE), as well as the Canadian Press (CP) Style Guides.

The Strategy:
Our team worked diligently to ensure that all of our work remain aligned with the branding guidelines of both the Ministry and BC Stats, as well as that of the Province’s Move. Commute. Connect. strategy and Clean BC. We made use of custom illustrations and infographics to present the survey data in a more engaging and easy-to-understand manner. Written content was also edited to capture the general public’s attention while ensuring alignment with all project requirements. Extensive considerations were also given in the design process to ensure positive representation of inclusivity and sustainability (e.g. gender neutral human figures in web icons).
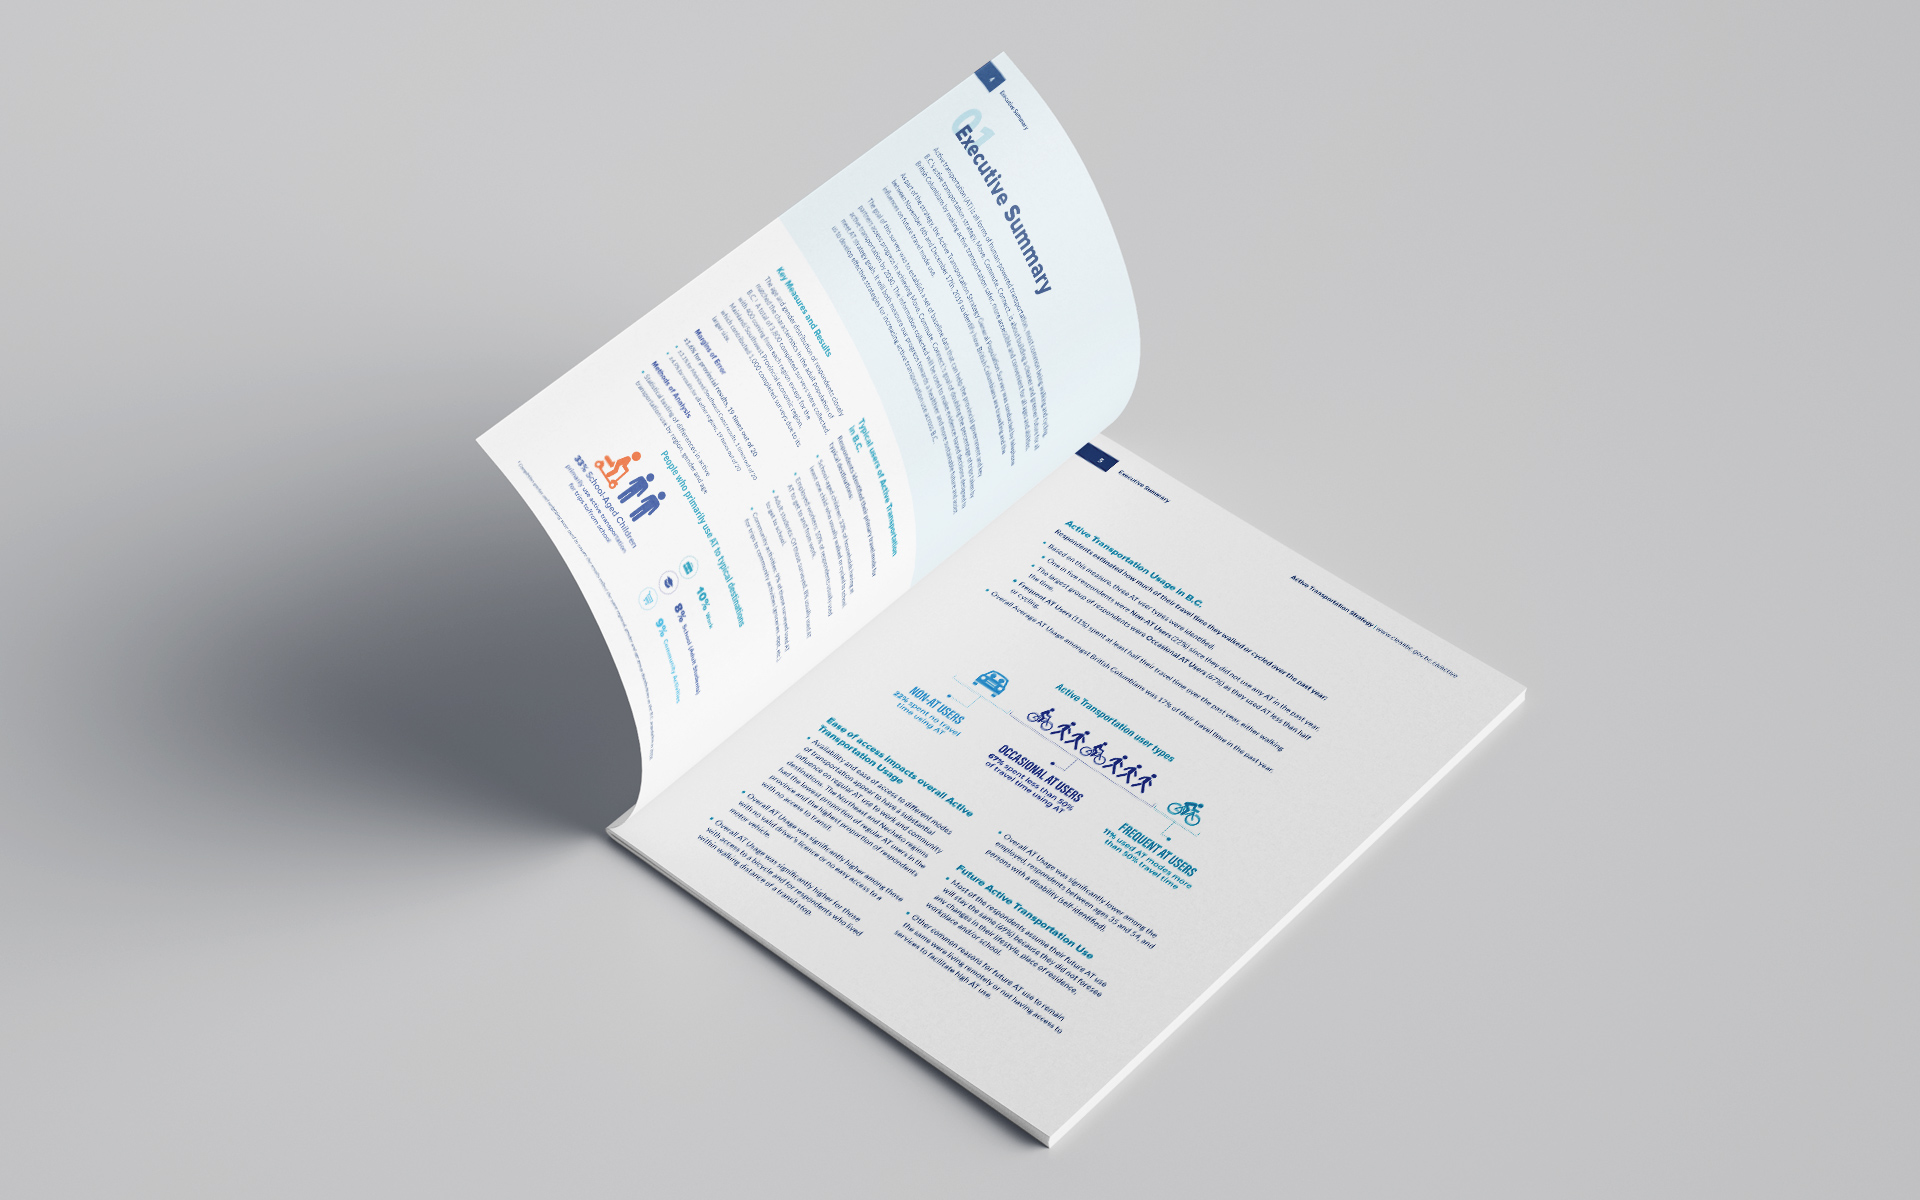
General Population Survey Report
This is a document around 30 pages in length that outlines the findings of the Active Transportation Strategy General Population Survey. This is the full length that provides the most complete information on the state of active transportation in British Columbia, including demographics, regional differences, and the Government of B.C.’s future plans, among others.
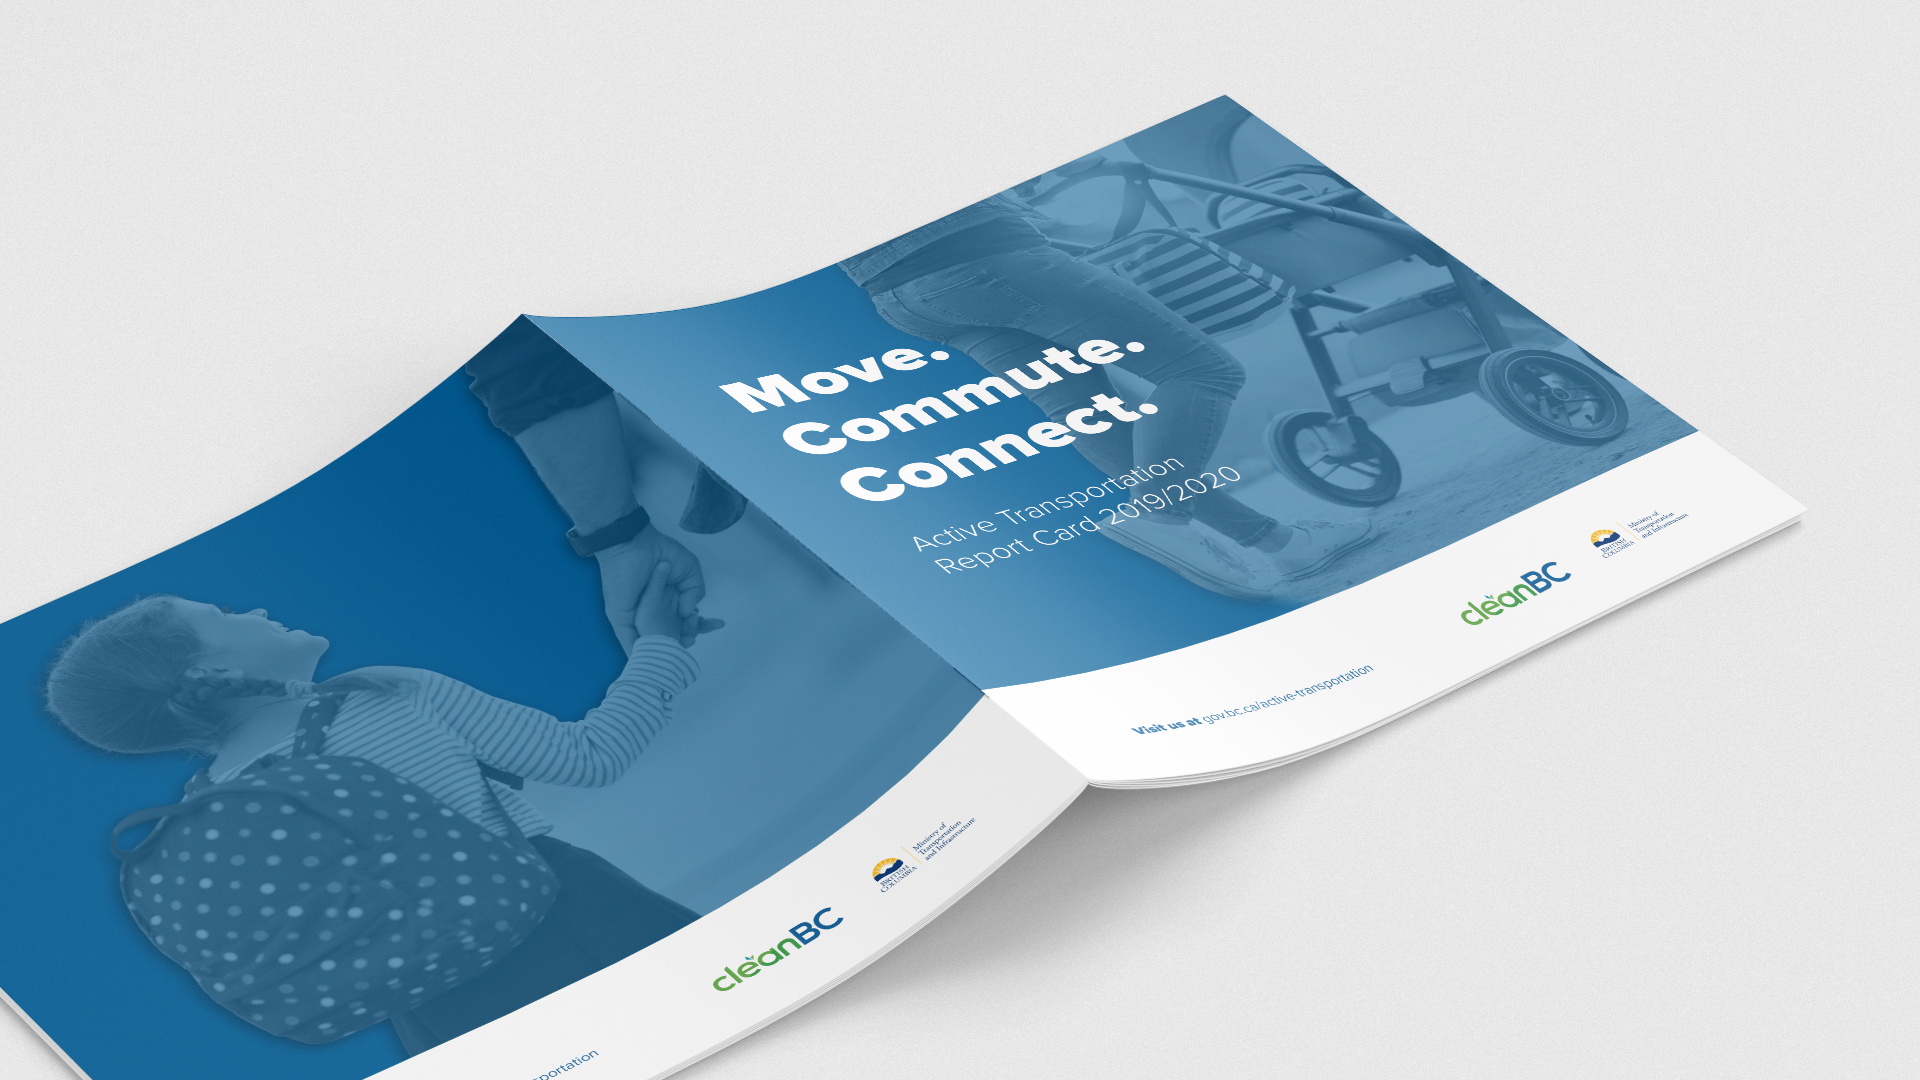
Report Card
This is a condensed version of the full length document, intended to provide readers with bite-sized information on the state of active transportation in British Columbia. The report card relies more heavily on custom illustrations and infographics to convey the most essential findings from the survey, going into less details on the process to make it a lighter read for the general public.
Results
The Ministry was highly satisfied with our work and all of the deliverables of this project have now been released to the public. The Ministry’s Active Transportation website has been updated with the web icons and infographics that we produced for a more engaging set of web content as well. It is anticipated that a printed version of the survey report document will also be produced at a later date.